> ## Documentation Index
> Fetch the complete documentation index at: https://densify-sync-changelog-1.mintlify.site/llms.txt
> Use this file to discover all available pages before exploring further.

# Node Overview Tab

export const Carousel = ({images = []}) => {
  const [currentIndex, setCurrentIndex] = useState(0);
  const scrollContainerRef = useRef(null);
  const scrollTimeoutRef = useRef(null);
  const goToSlide = slideIndex => {
    if (scrollContainerRef.current) {
      const scrollWidth = scrollContainerRef.current.offsetWidth;
      scrollContainerRef.current.scrollTo({
        left: scrollWidth * slideIndex,
        behavior: 'smooth'
      });
      setCurrentIndex(slideIndex);
    }
  };
  const scrollNext = () => {
    goToSlide(currentIndex >= images.length - 1 ? 0 : currentIndex + 1);
  };
  const scrollPrev = () => {
    goToSlide(currentIndex <= 0 ? images.length - 1 : currentIndex - 1);
  };
  const handleScroll = () => {
    if (scrollTimeoutRef.current) {
      clearTimeout(scrollTimeoutRef.current);
    }
    scrollTimeoutRef.current = setTimeout(() => {
      if (scrollContainerRef.current) {
        const scrollLeft = scrollContainerRef.current.scrollLeft;
        const scrollWidth = scrollContainerRef.current.offsetWidth;
        const newIndex = Math.round(scrollLeft / scrollWidth);
        setCurrentIndex(newIndex);
      }
    }, 150);
  };
  useEffect(() => {
    const scrollContainer = scrollContainerRef.current;
    if (scrollContainer) {
      scrollContainer.addEventListener('scroll', handleScroll);
    }
    return () => {
      if (scrollContainer) {
        scrollContainer.removeEventListener('scroll', handleScroll);
      }
    };
  }, []);
  if (!images || images.length === 0) {
    return null;
  }
  return <div className="carousel-wrapper">
            <div className="scroll-container" ref={scrollContainerRef}>
                {images.map((image, index) => <div key={index} className="carousel-slide">
                        {image.href ? <a href={image.href} target="_blank" rel="noopener noreferrer">
                                <Frame caption={image.caption}>
                                    <img src={image.src} alt={image.alt || image.caption} />
                                </Frame>
                            </a> : <Frame caption={image.caption}>
                                <img src={image.src} alt={image.alt || image.caption} />
                            </Frame>}
                    </div>)}
            </div>

            <button className="carousel-btn prev" onClick={scrollPrev} aria-label="Imagem Anterior">
                ❮
            </button>
            <button className="carousel-btn next" onClick={scrollNext} aria-label="Próxima Imagem">
                ❯
            </button>

            <div className="carousel-dots">
                {images.map((_, index) =
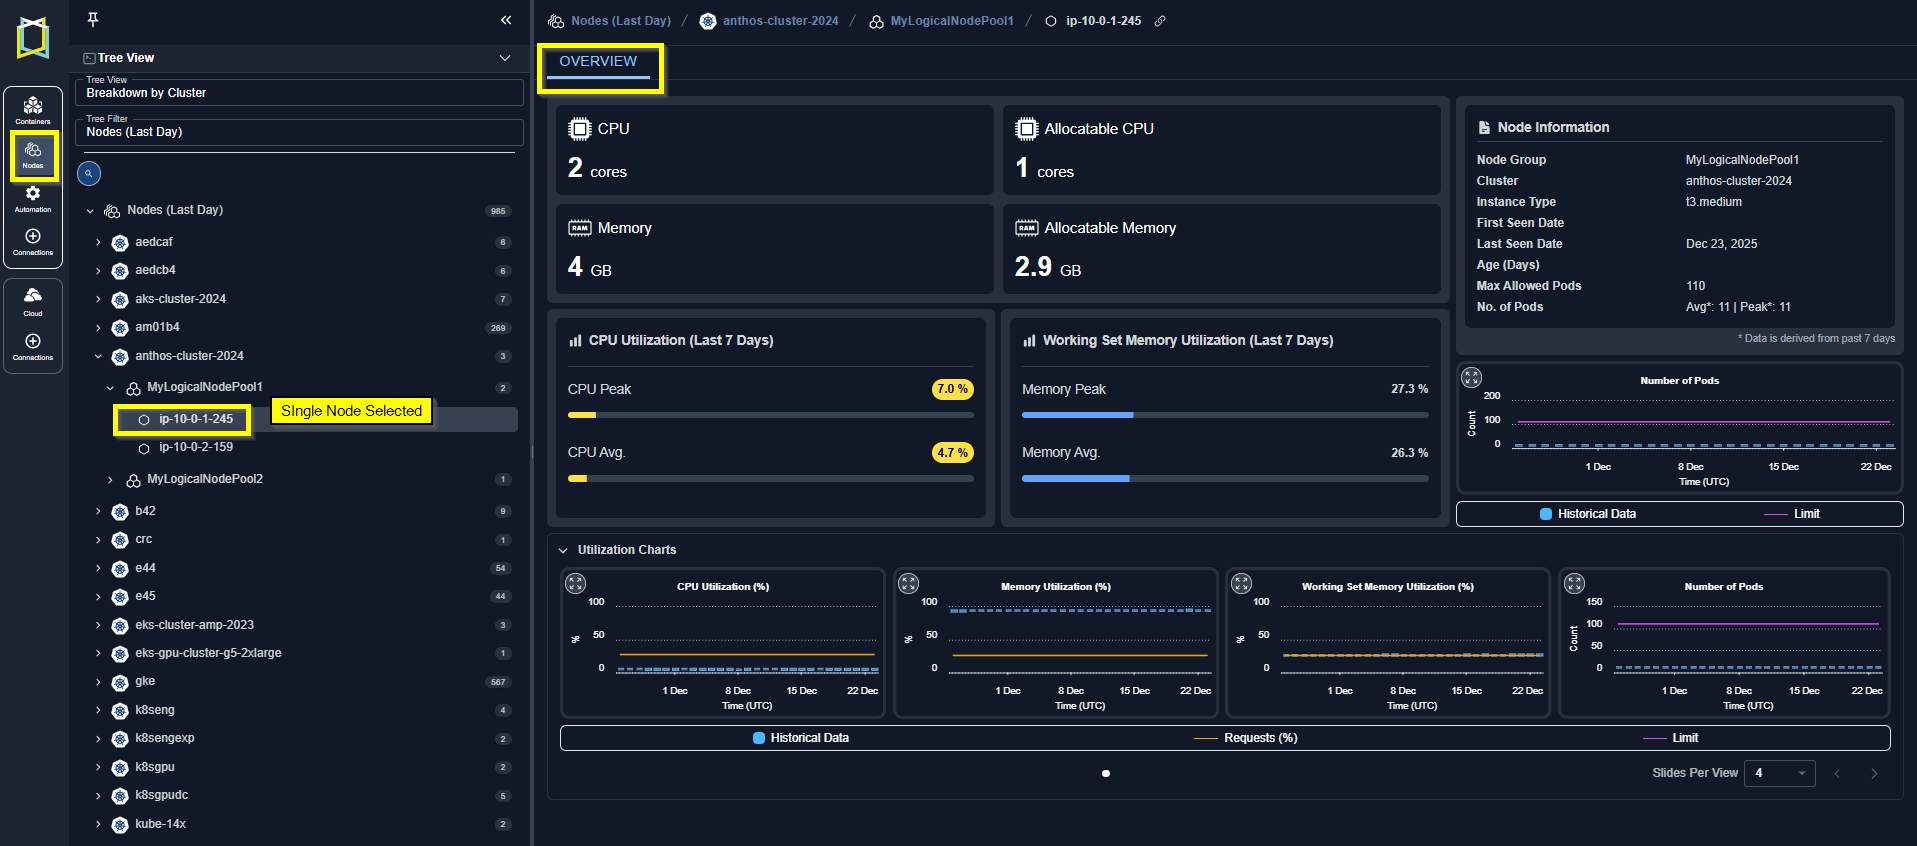
> <button key={index} className={`dot ${currentIndex === index ? 'active' : ''}`} onClick={() => goToSlide(index)} aria-label={`Ir para a imagem ${index + 1}`} />)}
            </div>

            <style jsx>{`
        .carousel-wrapper {
          position: relative;
          width: 100%;
          margin: 1.5em 0;
        }

        .scroll-container {
          display: flex;
          overflow-x: auto;
          scroll-snap-type: x mandatory;
          scroll-behavior: smooth;
          -webkit-overflow-scrolling: touch;
          scrollbar-width: none;
          -ms-overflow-style: none;
        }

        .scroll-container::-webkit-scrollbar {
          display: none;
        }

        .carousel-slide {
          flex: 0 0 100%;
          width: 100%;
          scroll-snap-align: center;
          padding: 0 8px;
          box-sizing: border-box;
        }
        
        .carousel-slide a {
          text-decoration: none;
          color: inherit;
          display: block;
        }

        .carousel-slide img {
          width: 100%;
          height: auto;
          display: block;
          border-radius: 8px;
        }

        .carousel-btn {
          position: absolute;
          top: 45%; /* Ajustado para não sobrepor os pontos */
          transform: translateY(-50%);
          background-color: rgba(0, 0, 0, 0.4);
          border: none;
          border-radius: 50%;
          width: 40px;
          height: 40px;
          font-size: 24px;
          color: #fff;
          cursor: pointer;
          z-index: 10;
          display: flex;
          align-items: center;
          justify-content: center;
          transition: background-color 0.2s;
        }

        .carousel-btn:hover {
          background-color: rgba(0, 0, 0, 0.7);
        }

        .carousel-btn.prev {
          left: 15px;
        }

        .carousel-btn.next {
          right: 15px;
        }

        /* ESTILOS PARA OS PONTOS (NOVO) */
        .carousel-dots {
          text-align: center;
          position: absolute;
          bottom: -25px; /* Posição abaixo do carrossel */
          width: 100%;
        }

        .dot {
          display: inline-block;
          width: 10px;
          height: 10px;
          border-radius: 50%;
          background-color: #c4c4c4; /* Cor do ponto inativo */
          margin: 0 5px;
          cursor: pointer;
          border: none;
          padding: 0;
          transition: background-color 0.3s;
        }

        .dot.active {
          background-color: #333; /* Cor do ponto ativo */
        }
      `}</style>
        </div>;
};

The cards on this tab provide a visual overview of a single node. When navigating the tree viewer, you will see this tab when a single node is selected.

You can also reach the modal view of this page, from the Node Details page by clicking the name, in the [Node](/docs-kubex/Content/Kubex/Nodes_Tab#node) column.

<Frame caption="Figure: Locating the Node Overview">
  <img src="https://mintcdn.com/densify-sync-changelog-1/aVqkyQxZWEfjH2OR/images/docs-kubex/Content/Kubex/03000096_548x225.png?fit=max&auto=format&n=aVqkyQxZWEfjH2OR&q=85&s=15984c0780ccbfe262070570ecc485d2" alt="" width="1917" height="846" data-path="images/docs-kubex/Content/Kubex/03000096_548x225.png" />
</Frame>

## Summary Card

Click any of the listed settings below to see a brief description. Complete descriptions of each setting are provided in the [Nodes Tab](/docs-kubex/Content/Kubex/Nodes_Tab).

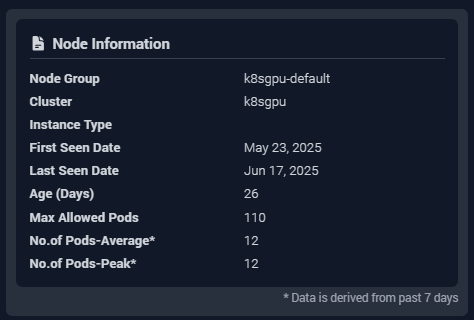
Resource configuration details are listed on this card.

<Frame caption="Figure: Summary Card">
  <img src="https://mintcdn.com/densify-sync-changelog-1/H_nw41Huh3hq0sab/images/docs-kubex/Content/Kubex/03000227_761x163.png?fit=max&auto=format&n=H_nw41Huh3hq0sab&q=85&s=8bfc59d0cab38c9d6f8b1ee8e10c3c8c" alt="" width="761" height="163" data-path="images/docs-kubex/Content/Kubex/03000227_761x163.png" />
</Frame>

<div style={{ width: "70%", display:"flex", flexDirection:"row", alignItems:"center", justifyContent: "space-between" }}>
  <ul>
    <li>
      <Tooltip tip="The total number of CPUs on this instance type.">
        CPU
      </Tooltip>
    </li>

    <li>
      <Tooltip tip="The number of CPUs that can be allocated to pods.">
        Allocatable CPU
      </Tooltip>
    </li>
  </ul>

  <ul>
    <li>
      <Tooltip tip="The total amount of memory on this instance type.">
        Memory
      </Tooltip>
    </li>

    <li>
      <Tooltip tip="The amount of memory that can be allocated to pods.">
        Allocatable Memory
      </Tooltip>
    </li>
  </ul>
</div>

## Node Information

Identifying details and key metrics are displayed in the card at the top of the page.

<Frame caption="Figure: Node Information">
  <img src="https://mintcdn.com/densify-sync-changelog-1/aVqkyQxZWEfjH2OR/images/docs-kubex/Content/Kubex/03000097.png?fit=max&auto=format&n=aVqkyQxZWEfjH2OR&q=85&s=17cb7aa3f63257cdd60860fd64e3112d" alt="" width="474" height="320" data-path="images/docs-kubex/Content/Kubex/03000097.png" />
</Frame>

<div style={{ width: "70%", display:"flex", flexDirection:"row", alignItems:"center", justifyContent: "space-between" }}>
  <ul>
    <li>
      <Tooltip tip="The name of the node group that contains the selected node. For nodes that do not belong to a node group, the node group value should be<cluster-name>-default”">
        Node Group
      </Tooltip>
    </li>

    <li>
      <Tooltip tip="The name of the cluster containing the selected node group/nodes.">
        Cluster
      </Tooltip>
    </li>

    <li>
      <Tooltip tip="The node's instance type. In cases where the instance type cannot be determined (i.e. bare-metal, private cloud environments) the primary node type is indicated as: CPU x memory size, e.g. 8x16. A dash (-) indicates that the node instance details could not be determined.">
        Instance Type
      </Tooltip>
    </li>

    <li>
      <Tooltip tip="The date, on which this instance was first discovered by Densify.">
        First Seen Date
      </Tooltip>
    </li>

    <li>
      <Tooltip tip="The date, on which this instance last had CPU utilization data collected by First Seen DateThe date, on which this instance was first discovered by Densify..">
        Last Seen Date
      </Tooltip>
    </li>
  </ul>

  <ul>
    <li>
      <Tooltip tip="The number of days since the node was first discovered by First Seen DateThe date, on which this instance was first discovered by Densify..">
        Age (days)
      </Tooltip>
    </li>

    <li>
      <Tooltip tip="The maximum number of pods allowed on this node, based on their optimal configuration.">
        Max Allowed Pods
      </Tooltip>
    </li>

    <li>
      <Tooltip tip="The average number of pods running on this node, during the past 7 days of history.">
        No. of Pods - Average
      </Tooltip>
    </li>

    <li>
      <Tooltip tip="The maximum number of pods running on this node during the past 7 days of history.">
        No. of Pods - Peak
      </Tooltip>
    </li>
  </ul>
</div>

Please observe the following for this set of data:

<ul>
  <li>Missing data is indicated with a dash (-).</li>
  <li>The data is derived from the past 7 days of history.</li>
</ul>

## Utilization Summary

The next 2 cards summarize potential resource risks for the node, and the containers running on the node.

<Frame caption="Figure: Utilization  Details">
  <img src="https://mintcdn.com/densify-sync-changelog-1/aVqkyQxZWEfjH2OR/images/docs-kubex/Content/Kubex/03000098_762x202.png?fit=max&auto=format&n=aVqkyQxZWEfjH2OR&q=85&s=8131e35b186b9d88f175be9014c463fd" alt="" width="762" height="202" data-path="images/docs-kubex/Content/Kubex/03000098_762x202.png" />
</Frame>

<div style={{ width: "70%", display:"flex", flexDirection:"row", alignItems:"center", justifyContent: "space-between" }}>
  <ul>
    <li>
      <Tooltip tip="The average CPU utilization for this node. The cell will be shaded red when the value exceeds 90%.">
        CPU Average(%)
      </Tooltip>
    </li>

    <li>
      <Tooltip tip="The maximum CPU utilization for this node. The cell will be shaded red when the value exceeds 90%.">
        CPU Peak (%)
      </Tooltip>
    </li>
  </ul>

  <ul>
    <li>
      <Tooltip tip="The average memory utilization for this node. The cell will be shaded red when the value exceeds 90%.">
        Memory Average (%)
      </Tooltip>
    </li>

    <li>
      <Tooltip tip="The maximum memory utilization for this node. The cell will be shaded red when the value exceeds 90%.">
        Memory Peak (%)
      </Tooltip>
    </li>
  </ul>
</div>

## GPU Summary

This card summarizes the GPU allocation and for the selected node. This card is only displayed if GPU resources are availble on the selected instance type. A hyperlink at the bottom of the card takes you to the GPU page.

<Frame caption="Figure: GPU Summary">
  <img src="https://mintcdn.com/densify-sync-changelog-1/H_nw41Huh3hq0sab/images/docs-kubex/Content/Kubex/03000229_501x163.png?fit=max&auto=format&n=H_nw41Huh3hq0sab&q=85&s=9de0d903e5aa2deee5a7a8ebf8d67d67" alt="" width="501" height="163" data-path="images/docs-kubex/Content/Kubex/03000229_501x163.png" />
</Frame>

<div style={{ width: "70%", display:"flex", flexDirection:"row", alignItems:"center", justifyContent: "space-between" }}>
  <ul>
    <li>
      <Tooltip tip="The GPU model configured on this node.">
        GPU Model
      </Tooltip>
    </li>

    <li>
      <Tooltip tip="The total GPUs available on this node.">
        GPUs
      </Tooltip>
    </li>
  </ul>

  <ul>
    <li>
      <Tooltip tip="The number of GPUs that can be allocated to pods.">
        Allocatable GPUs
      </Tooltip>
    </li>

    <li>
      <Tooltip tip="The amount of GPU memory that can be allocated to pods.">
        Allocatable GPU Memory
      </Tooltip>
    </li>
  </ul>
</div>

## Number of Pods and Utilization Charts

This chart summarizes the number of pods that have been running on this node. You can open a modal view to see more details. See [Analysis Details Table](/docs-kubex/Content/Kubex/AI_Analysis_Details_Table) for details on using the options in the modal view.

Slide Show: Number of Pods Chart (Click left/right arrows to see the other slides.)

<Carousel
  images={[
{
  src: "/images/docs-kubex/Content/Kubex/03000099_490x342.png",
  caption: "Expand to Modal View",
  alt: "Expand to Modal View"
},
{
  src: "/images/docs-kubex/Content/Kubex/03000135_537x385.png",
  caption: "Number of Pods - Modal View (Daily)",
  alt: "Number of Pods - Modal View (Daily)"
},
{
  src: "/images/docs-kubex/Content/Kubex/03000205_537x385.png",
  caption: "Number of Pods - Modal View (Hourly)",
  alt: "Number of Pods - Modal View (Hourly)"
},
{
  src: "/images/docs-kubex/Content/Kubex/03000228_537x385.png",
  caption: "Selecting Other Metrics",
  alt: "Selecting Other Metrics"
}
]}
/>

## Utilization Charts

The last section provides utilization charts that show hourly min/max and sustained activity for the selected node. You can also expand any chart to the modal view and select other metrics for review. See [Analysis Details Table](/docs-kubex/Content/Kubex/AI_Analysis_Details_Table) for details on using these charts to review workload data.

<div style={{ width: "80%", display:"flex", flexDirection:"row", alignItems:"center", justifyContent: "space-between" }}>
  <ul>
    <li>CPU Utilization (%)</li>
    <li>Memory Utilization (%)</li>
    <li>Working Set Memory Utilization (%)</li>
  </ul>

  <ul>
    <li>GPU Utilization (%)</li>
    <li>GPU Memory Utilization (%)</li>
    <li>No. of Pods</li>
  </ul>
</div>

#### Video Resources

<AccordionGroup>
  <Accordion title="Using the Tree Viewer">
    <iframe frameborder="0" height="310" src="https://player.vimeo.com/video/1038945637?title=0&byline=0&portrait=0&badge=0&autopause=0&player_id=0&app_id=58479" width="550" />

    <a href="https://player.vimeo.com/video/1038945637?title=0&byline=0&portrait=0&badge=0&autopause=0&player_id=0&app_id=58479" target="_blank">Using the Tree Viewer</a>
  </Accordion>

  <Accordion title="Using the Utilization Charts">
    <iframe frameborder="0" height="310" src="https://player.vimeo.com/video/1042992591?badge=0&autopause=0&player_id=0&app_id=58479" width="550" />

    <a href="https://player.vimeo.com/video/1042992591?badge=0&autopause=0&player_id=0&app_id=58479" target="_blank">Using the Utilization Charts</a>
  </Accordion>
</AccordionGroup>
